Stockpile Volume Measurement AI
Segment every pile and delineate the toe automatically, so the survey stops waiting on someone tracing boundaries by hand.
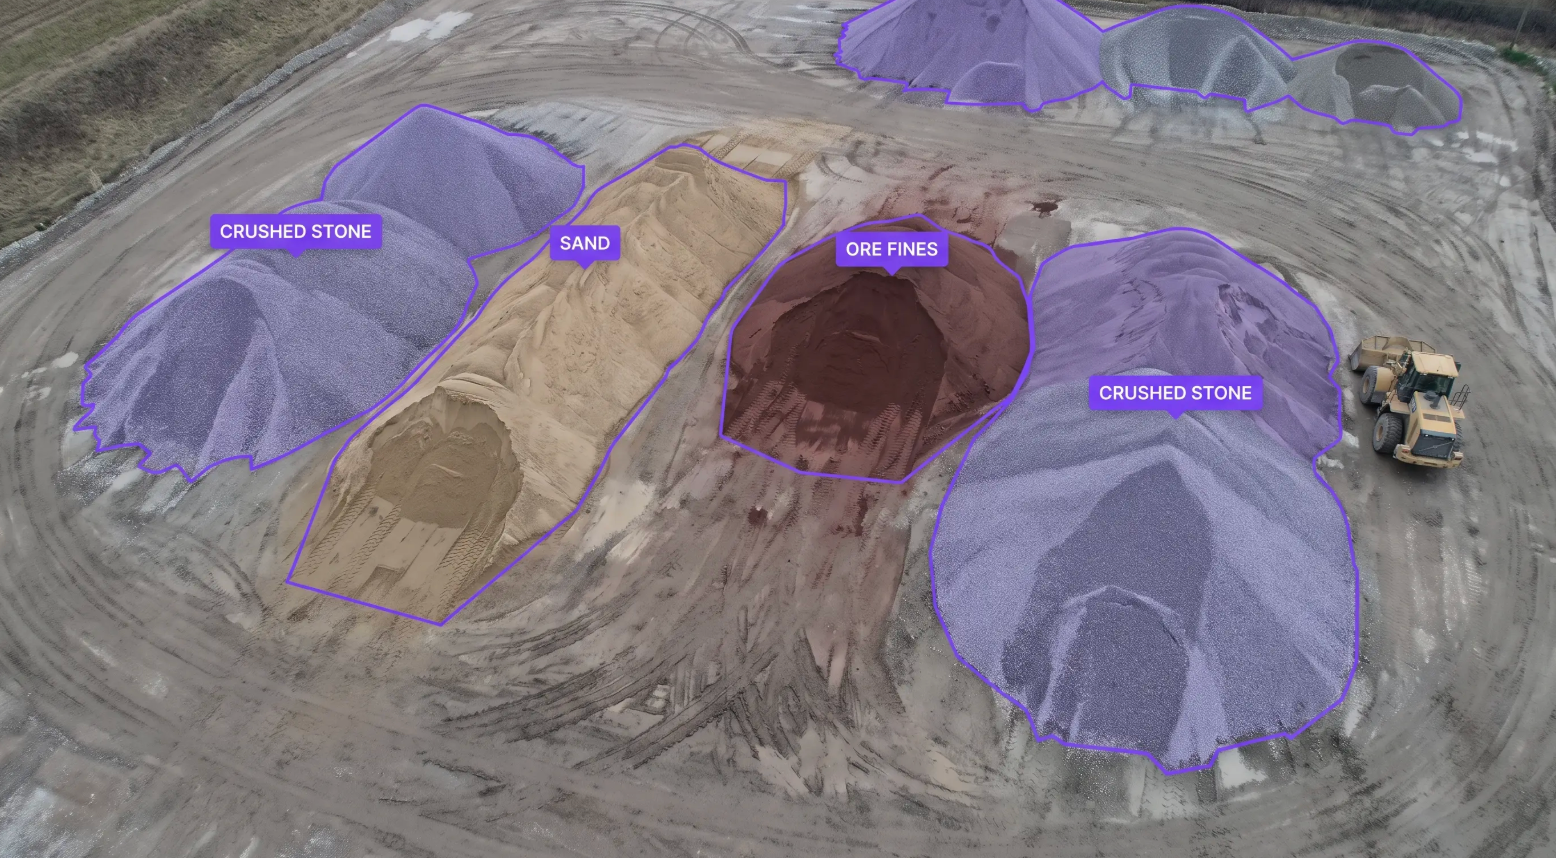
Stockpile Measurement AI Across Mine Pads, Quarries, Ports, and Cement Plants
Deploy Anywhere, Run Everywhere
Run stockpile analysis on drone survey imagery, fixed yard and shed cameras, existing site CCTV, the edge at remote pads, on-prem, in your VPC, or via API, wherever your run-of-mine pads, quarry yards, port stockyards, and covered storage need it.
One Platform, Full Adoption
Tools every site organization can adopt, from surveyors and drone pilots to production accounting, inventory control, and the plant team that has to reconcile at month end, no separate ML team required to ship and own detection models.
Secure and Audit-Ready
Data stays safe with SOC 2 Type II compliance, encrypted data, and an uptime SLA, with dated, image-backed pile records that support inventory reconciliation, month-end close, financial audit evidence, and ISO 9001 quality systems.
- Pile Segmentation & Toe Delineation
- Material Type Classification
- Pile Count & Site Inventory
- Change Detection Between Surveys
- Shed & Bunker Level Monitoring
- Survey-Ready Records
Talk to a vision AI engineer who's shipped stockpile analysis on real sites.
A toe line traced three different ways by three different people, a survey that sits in a queue because someone has to hand-draw boundaries around forty piles, or a covered shed nobody can fly that gets estimated by eye every month can mean an inventory number that moves when the operator changes rather than when the pile does, a month-end close that waits on a survey, or a variance nobody can explain to an auditor. Bring us your toughest problems and we'll map a working solution.
Ask us about:
- Solution architecture for inventory reconciliation, month-end close, production accounting, and financial audit evidence, alongside your existing survey and photogrammetry workflow
- Live demo on your own drone survey imagery and yard camera footage, across your materials, pad surfaces, and weather
- Deployment options: drone imagery pipelines, fixed yard and shed cameras, existing CCTV, edge at remote sites, on-prem, air-gapped, or VPC, with integration into your survey, GIS, and ERP systems
- ROI modeling against survey turnaround time, manual boundary tracing hours, inventory variance, and the cost of estimating covered storage by eye
Over 16,000 organizations build with Roboflow.
- Rivian
- Pella
- Chobani
- USG Corporation
- BNSF Railway
- American Woodmark
Vision AI is transforming businesses
Customers across the board are solving complex challenges and driving meaningful impact.
- Automotive customer
$10 million
Saved by automatically detecting defects on the production line
- Logistics & freight company
90%
Less time spent manually tracking shipping inventory
- Building materials supplier
60%
Lower customer return rate with improved product quality