Spaghetti Diagram AI

Draw every operator and forklift path from overhead video, with travel distance per cycle, shift, and layout.
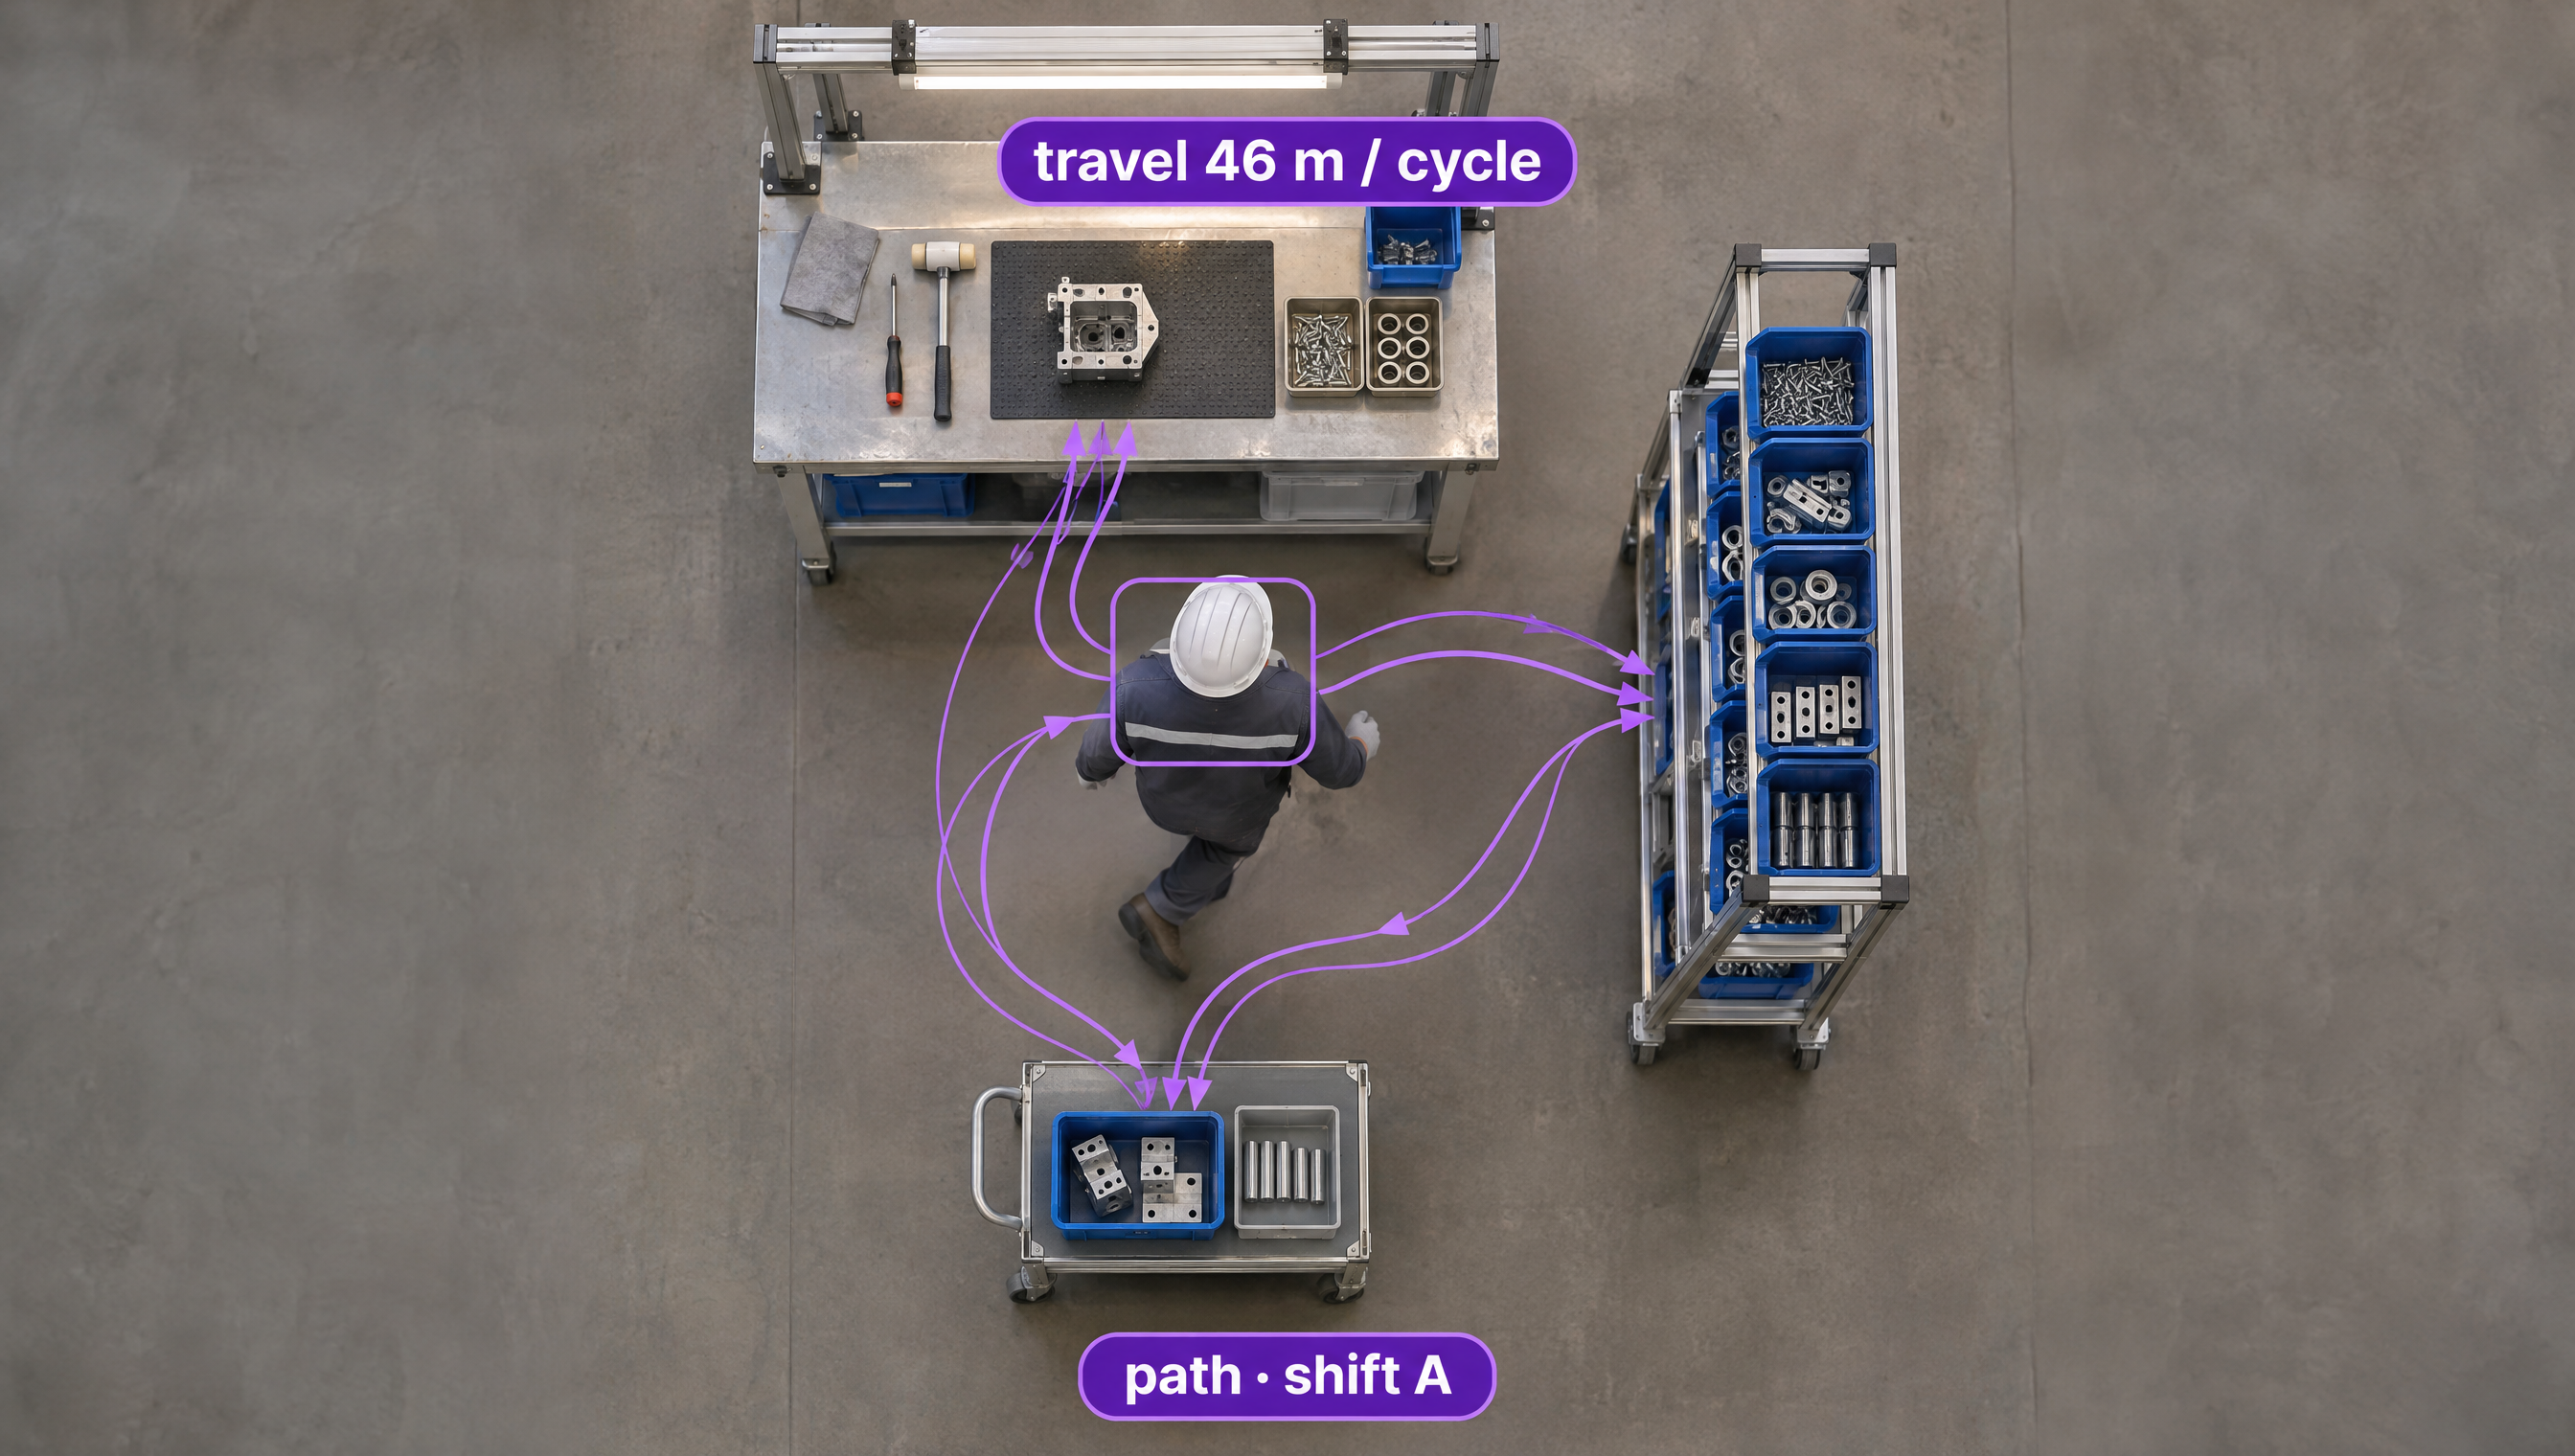
Top-down view tracking a worker's walking path between a workbench, a tall parts rack, and a rolling cart in a factory. Purple motion arrows illustrate a travel distance of 46 meters per cycle during shift A.

Spaghetti Diagram AI for the Toughest Cells, Lines, and Warehouses

  • Deploy Anywhere, Run Everywhere

    Run automated spaghetti diagrams on the overhead cameras you already have or a temporary camera over the cell, on the edge, on-prem, air-gapped, in your VPC, or via API.

  • One Platform, Full Adoption

    Tools every operations team can adopt, from lean and continuous improvement engineers to industrial engineers, supervisors, and plant management, no separate ML team required.

  • Secure, Compliant, and Audit-Ready

    Data stays safe with SOC 2 Type II compliance, encrypted data, and an uptime SLA, with face blurring at the edge and paths grouped by station and job, not by person.

  • Operator Paths Drawn from Overhead Video
  • Travel Distance per Cycle & Shift
  • Before/After Layout Comparison
  • Forklift & Material Flow Paths
  • Privacy-Safe (No Face ID) Tracking
  • Kaizen-Ready Reports
“The vision AI solutions we developed with Roboflow have been a core component of connecting our teams and unlocking their ability to collaborate.”

Lou Stocco

Director of Manufacturing Advanced Analytics, USG

Talk to a Vision AI engineer who's shipped in manufacturing.

Bring us your toughest motion waste problem and we'll map a working solution.

Ask us about:

  • Solution architecture that fits your cells, camera placement, and floor plan
  • A live demo on overhead video from your own work areas
  • Deployment options: existing cameras and edge, on-prem, air-gapped, or VPC
  • ROI modeling against walking time, layout changes, and IE hours

Over 80,000 organizations build with Roboflow.

  • Rivian
  • Pella
  • Chobani
  • USG Corporation
  • BNSF Railway
  • American Woodmark
Start where you are

Vision AI is transforming businesses

Customers across the board are solving complex challenges and driving meaningful impact.

  • Automotive customer

    $10 million

    Saved by automatically detecting defects on the production line

  • Logistics & freight company

    90%

    Less time spent manually tracking shipping inventory

  • Building materials supplier

    60%

    Lower customer return rate with improved product quality

Map Every Step, from the First Walk to the New Layout

Add a continuous motion study to your lean work with Roboflow Vision AI for spaghetti diagrams. Built for plants where a spaghetti diagram means an engineer following one operator for an hour with a pencil and a printed layout, where the drawing covers one person on one shift, and where nobody redraws it after the layout changes to prove the kaizen worked.

From clipboard to camera:

  • Track each operator through the cell with overhead cameras and draw their path on your floor plan, cycle after cycle.
  • Map camera pixels to real floor positions with perspective correction, so distances come out in meters or feet.
  • Keep every path for every shift, so the diagram reflects the whole week, not the hour someone was watching.

Quantify motion waste:

  • Measure travel distance and walking time per cycle and per shift, and find the trips that add the most distance.
  • Show where paths cross, where people wait, and where they double back with heatmaps and dwell time by zone.
  • Draw forklift, cart, and material flow paths in the same view, alongside forklift detection and factory flow.

Feed layout changes and time studies:

  • Compare paths before and after a layout change, a new fixture, or a moved supermarket, and report the distance saved.
  • Hand walking time to time studies and cycle time monitoring, so motion waste shows up in standards and daily results.
  • Export paths and distances to your kaizen reports, spreadsheets, and BI dashboards over REST, MQTT, or a database write.

Bring intelligence to every layout decision today. Prove where the walking is, cut it, and show the result on the next diagram.

‍

Frequently asked questions

What is an automated spaghetti diagram?

A spaghetti diagram is a lean tool that traces the path a person or material takes through a process, so teams can see wasted motion. An automated spaghetti diagram draws the same picture from overhead video: computer vision detects and tracks each operator, maps their position to the floor plan, and plots the path and distance for every cycle.

Where do the cameras go?

Overhead or high-angle cameras that see the whole work area give the cleanest paths. One wide camera often covers a cell, and larger areas use several cameras mapped to the same floor plan. We'll review your layout and existing cameras before any hardware is added.

How do we map paths to our floor plan?

You mark a few reference points on the floor and the matching points on your layout drawing. Roboflow's perspective correction turns each camera view into floor coordinates, so paths line up with your CAD or PDF layout and distances are measured in real units.

How do you handle operator privacy and union concerns?

Spaghetti diagrams measure the process, not the person. There is no face recognition, faces can be blurred at the edge before any frame is stored, paths are grouped by station and job, and retention follows your policy. Plants that bring operators in early get the best results, because the walking the diagram finds is walking that makes the job harder.

Roboflow serves as the measurement engine, and your lean and industrial engineering teams own the layouts, process boundaries, and improvement targets.

‍